


NASA’s New Scientific Breakdown of Dramatic Caldor and Dixie Fires
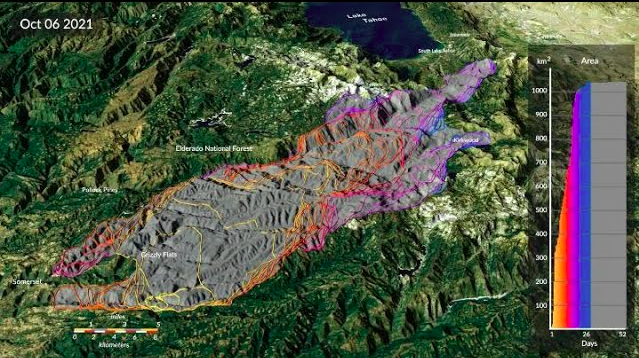
This visualization shows the spread of the Caldor fire between August 15 and October 6, 2021, and the Dixie fire between July 14 and October 22, 2021, updated every 12 hours from a new fire detection and tracking approach based on near-real time active fire detections from the VIIRS sensor on the Suomi-NPP satellite.
The yellow outlines track the position of the active fire lines for the last 60 hours, with the latest location of the fire front in the brightest shade of yellow.
The red points show the location of active fire detections, while the grey region shows the estimated total area burned. The graph shows the cumulative burned area in square kilometers.
Do not forget to share your opinion with us to provide you with the best posts !


I was wondering if you ever considered changing the layout of
your site? Its very well written; I love what youve got
to say. But maybe you could a little more in the way of content so people could connect with it better.
Youve got an awful lot of text for only having one or 2 images.
Maybe you could space it out better?