


moon

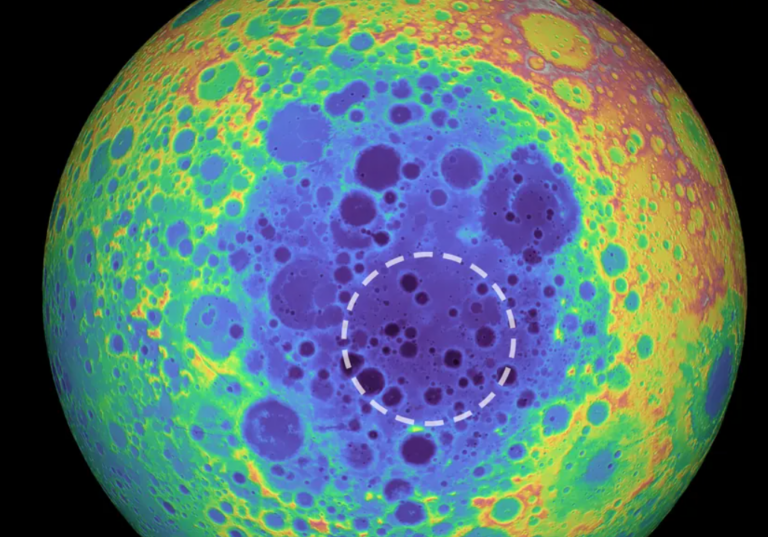
This false-color graphic shows the topography of the far side of the Moon. The warmer colors indicate high topography and the bluer colors indicate low topography. The dashed circle shows the location of the mass anomaly under the basin. NASA/Goddard Space Flight Center/University of Arizona