


Quantum Electrodynamics and Feynman Diagrams
What is Quantum Electrodynamics ?
In particle physics, quantum electrodynamics (QED) is the relativistic quantum field theory of electrodynamics. In essence, it describes how light and matter interact and is the first theory where full agreement between quantum mechanics and special relativity is achieved. QED mathematically describes all phenomena involving electrically charged particles interacting by means of exchange of photons and represents the quantum counterpart of classical electromagnetism giving a complete account of matter and light interaction.
In technical terms, QED can be described as a perturbation theory of the electromagnetic quantum vacuum. Richard Feynman called it “the jewel of physics” for its extremely accurate predictions of quantities like the anomalous magnetic moment of the electron and the Lamb shift of the energy levels of hydrogen
What is Feynman Diagrams ?
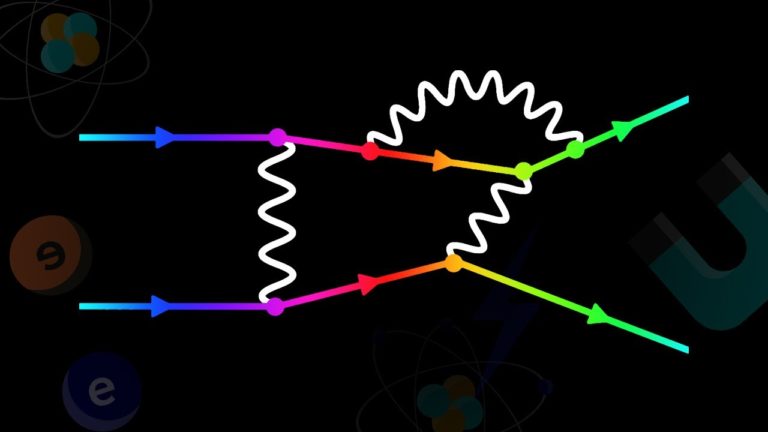
In theoretical physics, a Feynman diagram is a pictorial representation of the mathematical expressions describing the behavior and interaction of subatomic particles. The scheme is named after American physicist Richard Feynman, who introduced the diagrams in 1948. The interaction of subatomic particles can be complex and difficult to understand; Feynman diagrams give a simple visualization of what would otherwise be an arcane and abstract formula. According to David Kaiser, “Since the middle of the 20th century, theoretical physicists have increasingly turned to this tool to help them undertake critical calculations. Feynman diagrams have revolutionized nearly every aspect of theoretical physics.”While the diagrams are applied primarily to quantum field theory, they can also be used in other fields, such as solid-state theory. Frank Wilczek wrote that the calculations which won him the 2004 Nobel Prize in Physics “would have been literally unthinkable without Feynman diagrams, as would [Wilczek’s] calculations that established a route to production and observation of the Higgs particle.”
Feynman used Ernst Stueckelberg’s interpretation of the positron as if it were an electron moving backward in time. Thus, antiparticles are represented as moving backward along the time axis in Feynman diagrams.
The calculation of probability amplitudes in theoretical particle physics requires the use of rather large and complicated integrals over a large number of variables. Feynman diagrams can represent these integrals graphically.
A Feynman diagram is a graphical representation of a perturbative contribution to the transition amplitude or correlation function of a quantum mechanical or statistical field theory. Within the canonical formulation of quantum field theory, a Feynman diagram represents a term in the Wick’s expansion of the perturbative S-matrix. Alternatively, the path integral formulation of quantum field theory represents the transition amplitude as a weighted sum of all possible histories of the system from the initial to the final state, in terms of either particles or fields. The transition amplitude is then given as the matrix element of the S-matrix between the initial and the final states of the quantum system.
How do we reconcile electromagnetism with quantum physics?
How do we describe the interaction between two electrons?
What are virtual particles?
All these answers in 15 minutes!
Do not forget to share your opinion with us to provide you with the best posts !


Hi every one, here every person is sharing these familiarity, so it’s fastidious to read this website, and I used to go to see this weblog daily.