


stsci-01gw5ft7gxb5bkx2jz45m8hgrm

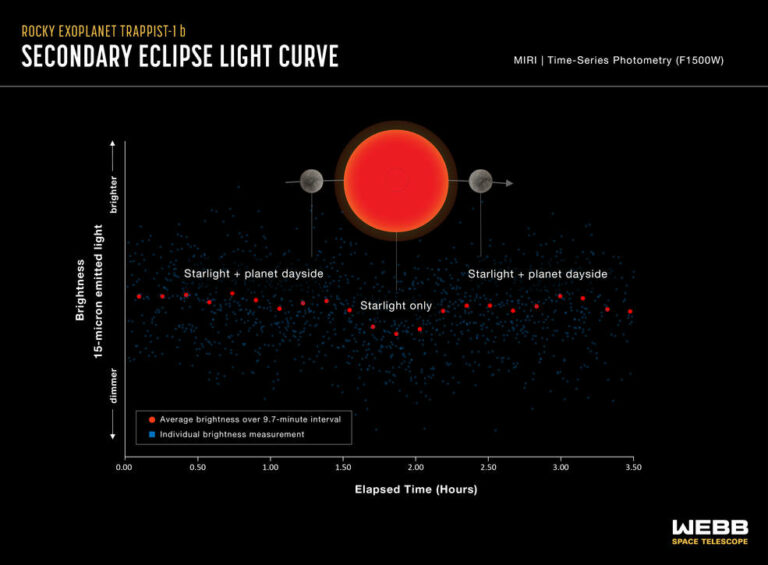
This light curve shows the change in brightness of the TRAPPIST-1 system as the innermost planet, TRAPPIST-1 b, moves behind the star. This phenomenon is known as a secondary eclipse. Astronomers used Webb’s Mid-Infrared Instrument (MIRI) to measure the brightness of mid-infrared light. When the planet is beside the star, the light emitted by both the star and the dayside of the planet reach the telescope, and the system appears brighter. When the planet is behind the star, the light emitted by the planet is blocked and only the starlight reaches the telescope, causing the apparent brightness to decrease. Astronomers can subtract the brightness of the star from the combined brightness of the star and planet to calculate how much infrared light is coming from the planet’s dayside. This is then used to calculate the dayside temperature. The graph shows combined data from five separate observations made using MIRI’s F1500W filter, which only allows light with wavelengths ranging from 13.5-16.6 microns to pass through to the detectors. The blue squares are individual brightness measurements. The red circles show measurements that are “binned,” or averaged to make it easier to see the change over time. The decrease in brightness during the secondary eclipse is less than 0.1%. MIRI was able to detect changes as small as 0.027% (or 1 part in 3,700). This is the first thermal emission observation of TRAPPIST-1 b, or any planet as small as Earth and as cool as the rocky planets in our solar system. The observations are being repeated using a 12.8-micron filter in order to confirm the results and narrow down the interpretations.
Credits: Illustration: NASA, ESA, CSA, J. Olmsted (STScI); Science: Thomas Greene (NASA Ames), Taylor Bell (BAERI), Elsa Ducrot (CEA), Pierre-Olivier Lagage (CEA)